Environmental Data
Applications of technology to effectively communicate environmental information and improve data collection.
Applications of technology to effectively communicate environmental information and improve data collection.

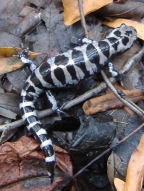
When Jeff started volunteering at Jug Bay Wetlands Sanctuary, one of the research projects was long-term monitoring of marbled salamander Ambystoma opacum migration. The number caught (and released) overnight varied from zero to over 600. It was apparent that the major movements happened on rainy nights. Jeff started to ask questions such as "how much rain is needed?", "what other factors are important - temperature, phase of the moon, etc.?" His answer was to start developing a database to collect the meteorological and other physical factors in order to analyze the salamander and physical data together. It was clear that other researchers and projects could also benefit from this shared common data. Five years and 1.4 million records later, this has grown into the Abiotic Data Warehouse.