
Analysis
Data Integration and Data Mining
Jeff designed and implemented a data warehouse to maintain environmental data common to several research projects at Jug Bay Wetlands Sanctuary, a component of the Chesapeake Bay National Estuarine Research Reserve system. The initial data mining applications were implemented to examine factors associated with salamander migration and box turtle movements. Intuitively, weather conditions are a factor in predicting movement of the animals, but the exact relationship between movements and weather as well as the specific factors are unknown.
Ecological Research Design
Jeff has also been significantly involved in research design for several projects.
Wild rice experiment
He was a core participant in a 2007 controlled experiment to measure the impact of goose grazing on wild rice (Zizannia aquatica) productivity. He participated in the initial set up of the experimental plots and periodically measured plant density and height. He also performed on-going statistical analysis to verify that validity was being maintained (e.g., that there was no statistically significant difference between the control and treatment areas before the treatments were performed and no significant difference between the measurements obtained by the various people assisting with the project). Jeff played an active role in the redesign of the experiment as unexpected field conditions reduced the feasibility of the data collection that was initially planned.
GIS Analysis
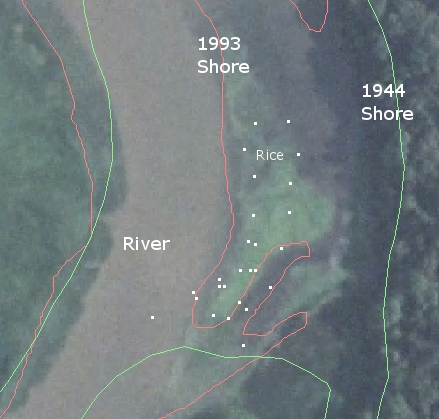
Jeff has obtained a wide variety of GIS layers to provide a geospatial context for the Jug Bay data warehouse. His initial GIS work has included comparing wild rice locations to historical river shorelines, mapping invasive plants as part of a monitoring and removal success study, and a time series of vernal pool boundaries for the 2007 and 2008 seasons. His GIS analysis has included delineating the subwatershed, particularly the area draining into the vernal pool, and his other work with digital elevation data clearly illustrated the presence of deltas associated with small stream valleys, which produced a small increase in marsh elevation and corresponding vegetation changes.
GPS track data (white dots) shows wild rice currently growing in marsh that historical shoreline data shows did not exist in 1944 but has been present since at least 1993.
Statistical Analysis
Jeff has conducted various types of statistical analysis in addition to that of the wild rice data described above.
- A dry period in 2008 prevented the Jug Bay vernal pool from filling until flooding rains occurred in May. Because the pool filled long after wood frog and spotted salamander mating season, there was no egg mass data to analyze. However, the heavy rains filled the pool unusually full, and Jeff measured the water depth periodically using random transects in addition to GPS tracks of the perimeter. Collection of the water depth and perimeter tracking has continued in subsequent years. Analysis of this data will estimate the pool's volume and the frequency distribution of depths and ultimately yield information about the typical hydroperiod for the pool.
- Jeff assisted with home range analysis of mud turtle movement and developed a Google Earth animation showing turtle positions over time.
- The fish survey database includes fields for analysis of the fish index of biotic integrity (IBI), including feeding structure, tolerance, native/introduced, and preferred spawning conditions (lithophilic or others). By including this information, the computation of the fish IBI requires less time and effort than prior occasional analysis.
- Jeff frequently performs statistical analysis (typically ANOVA) of data from his human-computer interaction research studies, e.g., a study of the usability of collaborative GIS work presented as a poster at the American Geophysical Union 2008 Fall Meeting.